

If you have clicked on this article then you are probably a college student or a working professional looking to upskill their competencies in order to keep up with the ever-evolving contemporary workplace.
You will be glad to hear that learning data visualisation software such as Tableau is a great way of accomplishing just that!
Regardless of what you study at university, having a strong grasp of tableau will go a long way toward building your CV and will also stand to you when it comes to completing those end of year assignments.
The is a vast array of online courses that students can avail of to help with their learning. Many of these courses are in fact free for students to try out.
In this article, I will walk you through the basic command and concepts surrounding using Tableau and creating your first data visualisations.
The software has gained significant traction in recent years as a result of its easy to use ‘drag and drop’ interface. Many companies continue to adopt data visualisation software across their operations as a means of optimising efficiency, surfacing underlying inefficiencies across their organisation.
Practising to create visualizations or entire visualization dashboards on the cloud will help you in your training. You will develop skills that will help you both create and communicate intelligence from your desktop in your marketing and management career.
You will also attain a certificate for your visualizations and dashboards that will help you to get secure a job which uses python such as in Marketing or management.
Learn more about SPSS here.


The importance of data visualization
The emphasis on Data Visualisation was substantial and justifiably so, with the increased gathering of consumer data evident over the last decade the problem many companies seem to find themselves in is how to compute this data. Doing so effectively would unlock new capabilities across a multitude of industries.
This is something that featured rather heavily in our module Operations Strategy this semester particularly the utilisation and computing of Big Data Analytics (BDA). Increased utilization of big data analytics in manufacturing operations, could facilitate cost reductions, improve planning, foster better prediction of events and enhance customer satisfaction.
It is no secret that Ireland is known for its educated workforce which can be attributed to its leading colleges such as Trinity College Dublin (TUD), Dublin City University (DCU) and University College Dublin (UCD) and many more!
These colleges offer some of the more advanced computer programming courses for third level students. Not only does this leave plenty of inspiration for those with an interest in computer science to set their sights on, but it also means that you will have no shortage of instructive material on learning Tableau available across the campuses.
Try not to get too caught up worrying about what your level of ability is, you will have little trouble finding the right tutor for you even if you have never so much as turned on a computer before. This is largely due to the volume of trained Tableau teachers available across the country.

Where can you learn tableau?
Kubicle is essential software for digital training which provides lessons, exercises, tests and certification for the development of its users. It provides a range of courses from beginner to advanced levels, initially introducing the topic and progressively building on the content as the lessons go on.
These courses stem from a range of areas including Data Fundamentals, Excel Analysis, Data Analytics and Office Communication and can be extremely beneficial for enhancing your capabilities within the workplace.
You can find a range of courses for learning across the Kubicle platform such as Tableau Essentials and Tableau Prep. The first course tableau Essentials primarily surrounded the manipulation of data, modelling and constructing interactive dashboards using the tableau workbook software.
The second course Tableau Prep introduces the accompanying software for both the cleaning and reshaping of data prior to repackaging in the form of suitable graphic representations.
Some more about Tableau...
Tableau has gained considerable traction within the workplace over the last decade and is currently the fastest-growing data visualisation tool used by businesses. It is used by data analysts to simplify raw data forms from software such as Excel into a format easily interpreted by companies and consumers alike.
The software is also commonly used by consultants to convey information and intelligence such as a company’s client information and employee activity with interactive capabilities for managerial use.
This was another factor which incentivises students and working professionals alike to learn how to use the software, as in a management, statistics or research career that you might plan to pursue after completing the course.
The courses which Kubicle provide on Tableau develop an array of crucial competencies as well as some invaluable soft skills that will ultimately contribute to greater prospects of career progression down the line.
This is true for a wide variety of professional career paths and is by no means confined to those containing components of data analysis and problem-solving.
Before we get started it is important to understand the benefits of familiarizing yourself with data analysis and visualisation software such as Tableau and its place within the workplace.
Visualization software is largely free online and you can learn from an introduction or advanced course.
Python is another platform that is widely adopted in both business and science. If you create visualizations and dashboards.
R programming can also help you with your tasks at work!

How are the courses structured?
Let’s take a look at what is perhaps one of the most renowned data visualisation courses amongst students and working professionals alike on the Kubicle education platform.
The learnings which students take from the Tableau Essentials course are quite extensive as the course delved into all aspects of the Tableau Workbook software. The course contains 44 lessons with 4 examinations on the covered topics along with interactive exercises to engage with as you completed the lessons.
The Course is extremely practical and tackles real-life problems that you can expect to arise within the workplace across a variety of industries—importing data sets from compatible software such as excel and providing an effective means of representing required data to a manager or client.
The manipulation and interactive capabilities which the software can provide are something that provide extreme valuable when applied to a raw data set. These data sets can often contain thousands of clients holding a multitude of columns of information on each.
Applying various filters allows you to tailor a data set giving it a more refined scope. A filter could be placed on various measures such as Date & Time, debtor days, sector etc. such that the data now represents only relevant fields.
Improve your data visualization skills for free from your desktop at home by taking free training on the cloud. Creating online dashboards from your desktop can help you to answer r complex and introduction level marketing and management questions.
If you create marketing and management dashboards on the cloud you will inherently take your training to the next level. The skills are free to learn and will help you to complete introduction python questions like a professional analyst.
What will you Learn using Tableau?
You will also pick up a thing or two about data visualization just through using the platform, for example, a Line Graph is most suitable when examining the effect of a single variable over time, its ability to present smaller changes makes it preferable over bar charts for this purpose.
Though Bar Charts would are often deemed more suitable when analysing the effect on numerous clients in business. Most Tableau courses outline the possibility of adding additional dimensions to your graphs, extending them to convey more information while occupying the same space.
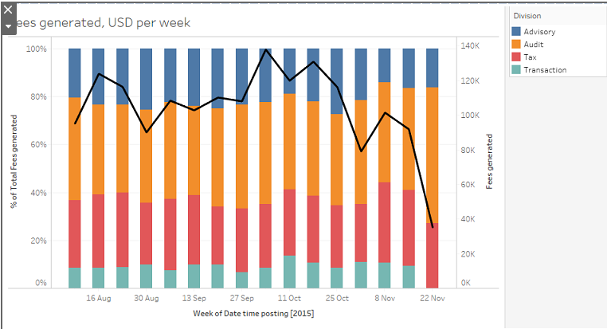
Merging graphs is sometimes a suitable method of adding increased information. This is often possible by adding a scale on the adjacent axis. Colour can also communicate information by categorising the data into divisions.
I have included an example of a graph that I created within Tableau, it combines a Line Chart and a Bar chart and divides fees generated into divisions such as Advisory, Audit, Tax and Transaction.
There is certainly no understating the role which data plays in the decision making has grown substantially over the past decade and with it, the need to effectively compute and communicate your results across organisational tiers such as for the interpretation of a manager.
This is certainly something you could implement within your work for more effective communication of information to a client, your manager or even for your own personal records!
There is certainly the need to effectively communicate massive amounts of data in a way that is easily accessible and understandable.
Why not try out learning Python too?
Ireland Tableau teachers: Choose your tutor on Superprof!
Data visualisation is becoming increasingly popular in the workplace. Now more than perhaps ever before students need to familiarise themselves with an array of data visualization software such as Tableau in order to keep up with the evolving workplace.
The training can help you to communicate intelligence to a marketing or management team with the aid of online visualizations on the cloud.
Learning marketing and management skills has never been so accessible with the help of free online visualization training on the cloud!
If you create visualizations on the cloud from the cloud on your desktop it will not only help you in your marketing or management training, but it can also help you in other aspects of business and science.
If you’re looking to brush up on your Data visualization skills then look no further than Superprof! Upon arrival on the website, you will find the best community comprised of millions of tutors around the world and has established a strong presence across Ireland.
With countless qualified Data science tutors available online with just a few simple clicks of a mouse, you’ll waste no time finding the right fit for you!
The Superprof platform also offers a degree of flexibility to students in how they learn that extends beyond that offered by other tutoring services within Ireland. If you plan on studying here, then the platform is the easiest way to pair up with a suitable teacher.
Irish Data and Tableau tutors are highly qualified and will be able to assess your specific weaknesses across the software and adapt to meet the needs of your busy schedule. This is something that really resonates with those who are in full-time employment or study and operate busy schedules.
Starting out learning how to use new software such as Tableau can be challenging. It can be particularly difficult to figure out where to find the right tutor to help you accomplish your goals across the data visualization software.
Having a Tableau tutor can also help to put your mind at ease as you will be progressing incrementally with each session. With the help of a Superprof Data Analytics tutor, you’ll be progressing in no time!
Summarise with AI:
Did you like this article? Leave a rating!